Graphs for Kids
Learn to Read and Create Graphs
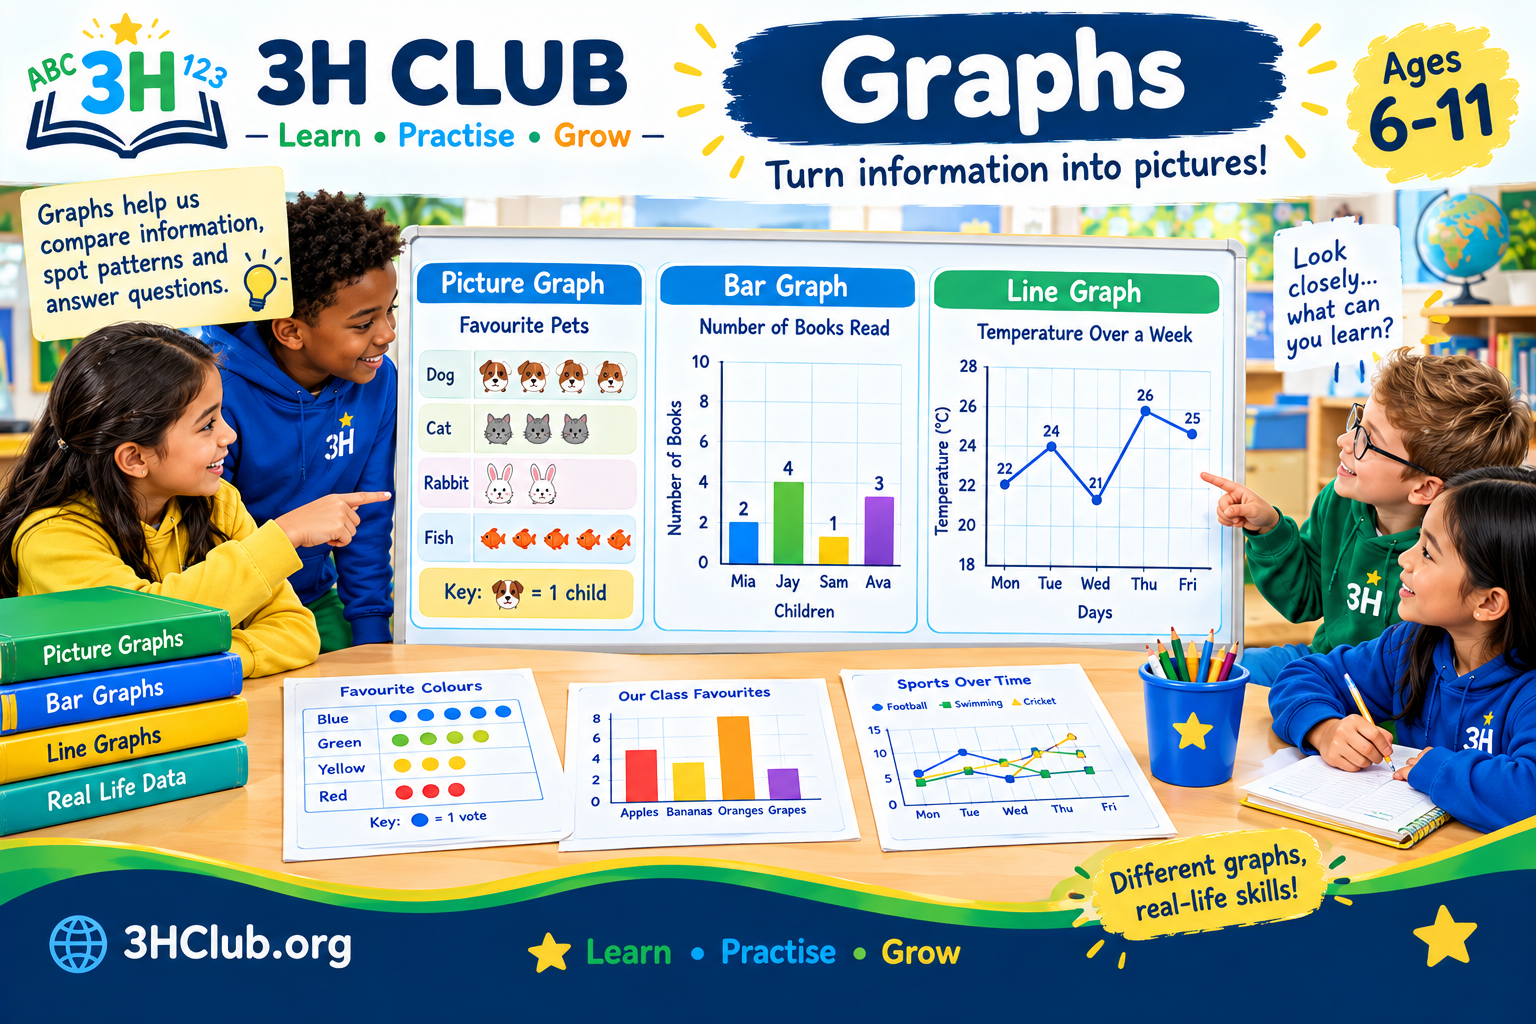
Graphs help us turn information into pictures that are easy to understand. They can show which fruit is the most popular, how the weather changes during a week, or how many books children have read.
You probably use information every day without even noticing it. When you compare scores, count your toys or check the weather, you are working with data. A graph helps you organize that data so you can spot differences, answer questions and discover patterns.
At 3HClub, we will explore graphs step by step. Start with simple pictures and bars, then move on to scales, comparisons and line graphs as your skills grow.
⭐ Starters — Ages 6–7
⭐⭐ Builders — Ages 8–9
⭐⭐⭐ Champions — Ages 10–11
By the end, you will be ready to collect information, display it in a graph and explain what it tells you. Let’s get started!
⭐ Starters — Ages 6–7: Discovering Graphs
What Is a Graph?
A graph is a way of showing information using pictures, bars, lines or other shapes. Instead of reading a long list of numbers, you can look at a graph to see what the numbers mean.
Imagine you ask five friends which fruit they like best. Their answers might be:
- Two friends choose apples.
- One friend chooses bananas.
- Two friends choose oranges.
You could write those answers in a list, but a graph makes them easier to compare.
Graphs help us answer questions such as:
- Which group has the most?
- Which group has the fewest?
- Are any groups equal?
- How many items are there altogether?
1. Picture Graphs
A picture graph, also called a pictograph, uses pictures or symbols to show information.
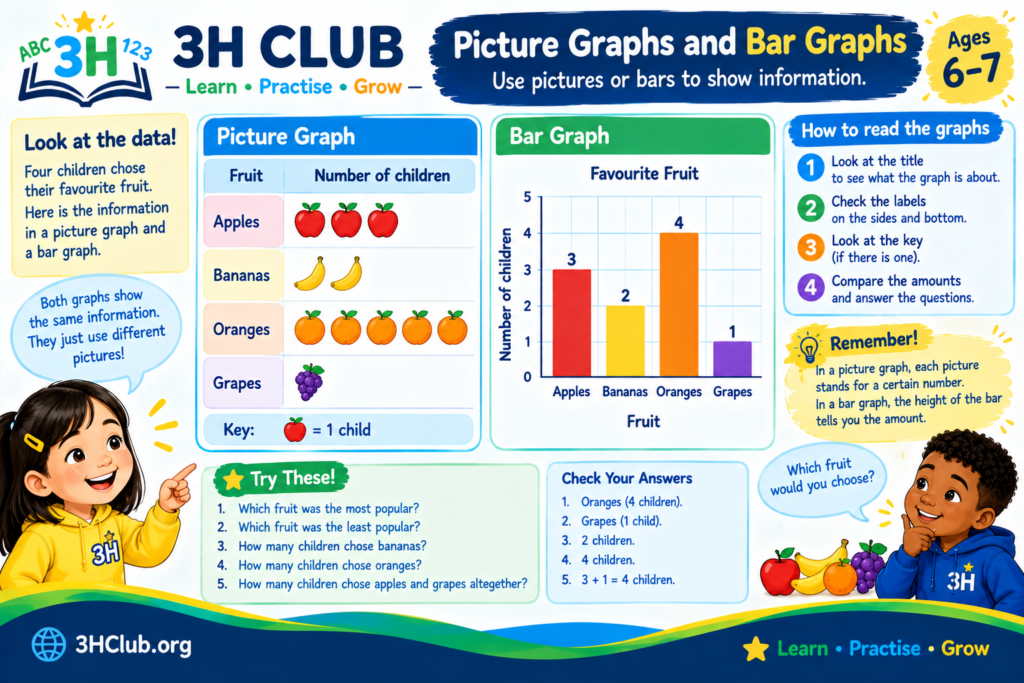
Imagine four children are asked to choose their favorite fruit.
| Favorite fruit | Number of children |
|---|---|
| Apples | 3 |
| Bananas | 2 |
| Oranges | 4 |
| Grapes | 1 |
We can show the same information using fruit symbols. In this example, each 🍎 represents one child who chose apples, each 🍌 represents one child who chose bananas, and so on.
| Fruit | Picture graph |
|---|---|
| Apples | 🍎 🍎 🍎 |
| Bananas | 🍌 🍌 |
| Oranges | 🍊 🍊 🍊 🍊 |
| Grapes | 🍇 |
Now you can see the results quickly.
- Oranges were the most popular choice.
- Grapes were the least popular choice.
- Apples were chosen by three children.
Remember: In this example, one picture represents one child. Always check what each picture stands for.
2. Bar Graphs
A bar graph uses bars to show how many items belong to different groups. A taller bar means a larger number, while a shorter bar means a smaller number.
Here is a simple bar graph showing how many books four children read in one week.
| Child | Books read |
|---|---|
| Mia | 2 |
| Jay | 4 |
| Sam | 1 |
| Ava | 3 |
A simple text version of the graph looks like this:
- Mia: 🟦🟦
- Jay: 🟦🟦🟦🟦
- Sam: 🟦
- Ava: 🟦🟦🟦
Each blue square represents one book. In a drawn bar graph, the squares would form bars that rise from the same starting line.
Jay read the most books, with four. Sam read the fewest, with one.
A proper bar graph usually has:
- A title to explain what the graph shows.
- Labels to tell you what the groups are.
- A number scale to help you count the values.
- Bars to show the amounts.
3. How to Read a Graph
Reading a graph means looking carefully at the information it shows.
Try these steps:
- Read the title to find out what the graph is about.
- Look at the labels to identify the groups.
- Check the numbers or key.
- Compare the bars or pictures.
- Use the information to answer questions.
For example, look at the books-read data above.
Question 1: Who read the most books?
Answer: Jay, with four books.
Question 2: How many books did Mia read?
Answer: Two books.
Question 3: How many books did Mia and Ava read altogether?
Answer: (2 + 3 = 5) books.
⭐ Starters Activity: Become a Graph Detective!
Look at this information about children’s favorite colors.
| Color | Number of votes |
|---|---|
| Blue | 4 |
| Green | 2 |
| Yellow | 3 |
| Red | 1 |
Answer the questions:
- Which color received the most votes?
- Which color received the fewest votes?
- How many votes did green receive?
- How many votes were there altogether?
- How many more votes did blue receive than red?
Check your answers
- Blue.
- Red.
- Two votes.
- (4 + 2 + 3 + 1 = 10) votes.
- (4 – 1 = 3) more votes.
⭐ Your Turn: Make Your Own Picture Graph
Ask a few friends or family members which animal they like best. You could choose cats, dogs, rabbits and birds.
Count the answers and draw one picture for each vote. Give your graph a title and label each row.
When you finish, ask yourself: Which animal was the most popular? Which was the least popular?
You have just collected data and presented it in a graph!
⭐⭐ Builders — Ages 8–9: Making and Comparing Graphs
You now know that graphs can help you understand information quickly. Next, you will learn how to organize data, use graph keys and scales, and compare groups more carefully.
1. What Is Data?
Data is information that we collect. It might be numbers, measurements, choices or observations.
For example, you could collect data about:
- The number of pets children have.
- Favorite sports in your class.
- Books borrowed from a library.
- Rainfall during a week.
- How children travel to school.
Before making a graph, it helps to organize your data in a table.
Suppose a group of children vote for their favorite sports.
| Sport | Number of votes |
|---|---|
| Football | 8 |
| Swimming | 5 |
| Cricket | 6 |
| Tennis | 3 |
This table gives us the information we need to create a graph.
2. Tally Charts and Frequency Tables
A tally chart helps you count and record answers as you collect them. Tally marks are often grouped in fives so they are easier to count.
For example, if children choose their favorite sport, you might record the votes like this:
| Sport | Tally | Frequency | |||||||
|---|---|---|---|---|---|---|---|---|---|
| Football | ` | / | ` | 8 | |||||
| Swimming | ` | /` | 5 | ||||||
| Cricket | ` | / | ` | 6 | |||||
| Tennis | ` | ` | 3 |
The frequency is the number of times an answer occurs. In the table, football has a frequency of eight because it received eight votes.
Tally charts are useful when collecting data, while frequency tables make the totals easy to read. You can then use the table to draw a graph.
3. Reading Bar Graphs
Bar graphs are especially useful when you want to compare separate groups.
Imagine you draw a bar graph using the favorite-sports data. The football bar reaches eight, swimming reaches five, cricket reaches six and tennis reaches three.
To read the graph, compare the height of each bar.
- Football has the most votes.
- Tennis has the fewest votes.
- Cricket received one more vote than swimming.
- Football received five more votes than tennis.
You can also find the total number of votes:
(8 + 5 + 6 + 3 = 22)
There were 22 votes altogether.
4. Understanding the Scale
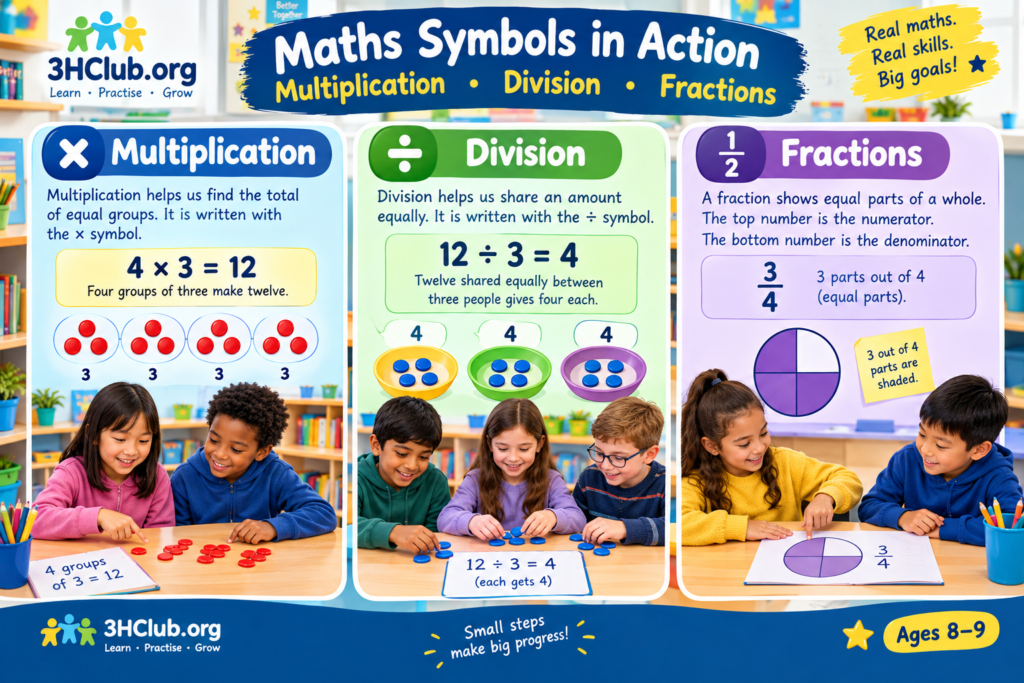
A graph’s scale tells you how the numbers are spaced along its number axis.
Some graphs count in ones:
(0, 1, 2, 3, 4, 5, \ldots)
Others count in twos, fives or tens:
(0, 2, 4, 6, 8, 10, \ldots)
A scale can help you show larger numbers without needing a huge graph.
For example, suppose a school library lends 20, 30, 10 and 40 books to four classes. You could use a scale that counts in tens.
| Class | Books borrowed |
|---|---|
| Class A | 20 |
| Class B | 30 |
| Class C | 10 |
| Class D | 40 |
If each step on the graph represents ten books, a bar reaching four steps represents 40 books.
Important: Always check the scale before reading a bar. If the scale counts in twos, each step means two—not one.
5. Picture Graphs with a Key
Picture graphs can also show larger amounts. When one picture represents more than one item, the graph needs a key.
Suppose a key says:
Key: ⭐ = 2 books
If a row contains four stars, it represents:
(4 \times 2 = 8) books.
If another row contains six stars, it represents:
(6 \times 2 = 12) books.
The key tells you how much each picture is worth. Without it, you might count the symbols but misunderstand the totals.
6. How to Create a Bar Graph
Follow these steps when making your own bar graph.
- Collect your data. Ask a question or record information.
- Organise the results. Put the groups and totals in a table.
- Choose a title. Make it clear what the graph shows.
- Draw and label the axes. One axis shows the groups, and the other shows the numbers.
- Choose a suitable scale. Make sure all the values fit.
- Draw the bars. Keep the bars the same width, with equal gaps between them.
- Check your graph. Make sure the labels, scale and bar heights match your data.
A clear graph lets someone understand your results without needing to ask you to explain every number.
⭐⭐ Builders Activity: Read the Data
A class records how many seedlings grew in four plant pots.
| Pot | Number of seedlings |
|---|---|
| A | 6 |
| B | 9 |
| C | 4 |
| D | 7 |
Answer these questions:
- Which pot had the most seedlings?
- Which pot had the fewest?
- How many seedlings grew in all four pots?
- How many more seedlings grew in pot B than pot C?
- If two more seedlings grew in pot A, how many would it have?
Check your answers
- Pot B, with nine seedlings.
- Pot C, with four seedlings.
- (6 + 9 + 4 + 7 = 26) seedlings.
- (9 – 4 = 5) seedlings.
- (6 + 2 = 8) seedlings.
⭐⭐ Challenge: Make a Graph with a Key
A school garden has 12 sunflowers, 8 roses and 10 daisies.
Create a picture graph using this key:
Key: 🌼 = 2 flowers
How many flower symbols should you draw for each type?
Answers
- Sunflowers: (12 \div 2 = 6) symbols.
- Roses: (8 \div 2 = 4) symbols.
- Daisies: (10 \div 2 = 5) symbols.
Remember to include a title and the key so that someone else can read your graph correctly.
⭐⭐⭐ Champions — Ages 10–11: Exploring Line Graphs and Interpreting Data
You are ready to work with more detailed information. At this level, you will explore line graphs, interpret changes over time, compare data and think carefully about whether a graph tells a fair story.
1. What Is a Line Graph?
A line graph shows how a value changes, often over time. It uses points to represent measurements, and the points are usually joined by straight lines.
Line graphs are useful for showing things such as:
- The temperature during a week.
- The height of a plant as it grows.
- The distance travelled during a journey.
- The amount of rainfall each day.
- Changes in a runner’s speed or distance.
A bar graph is usually better for comparing separate categories, such as favorite sports. A line graph is often better for showing how a measurement changes over time.
2. Reading a Line Graph
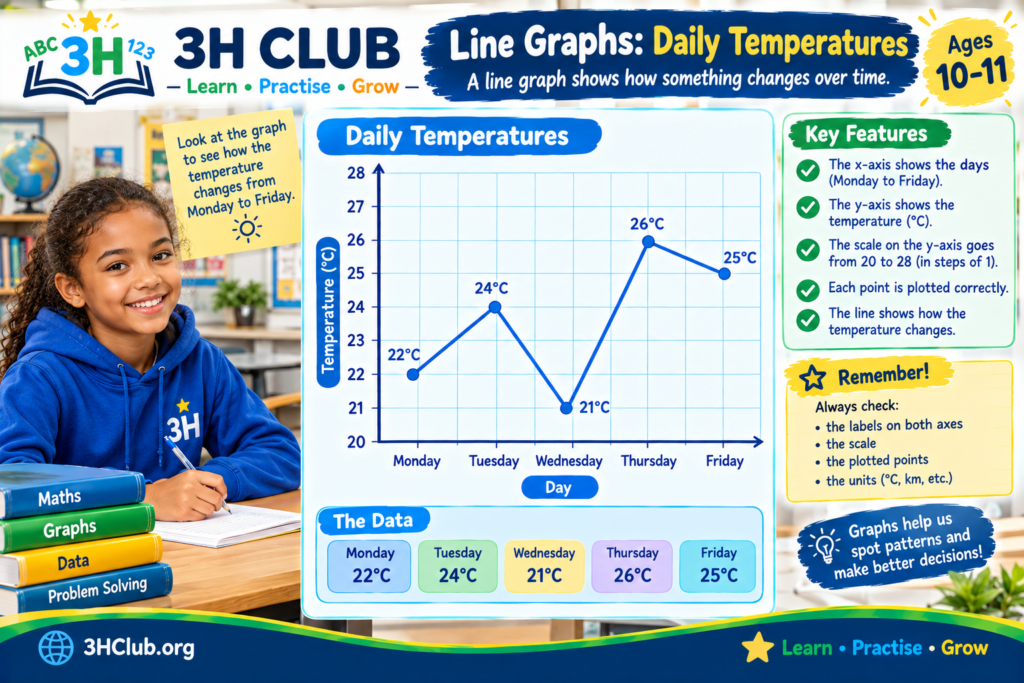
Imagine a weather station records the afternoon temperature over five days.
| Day | Temperature |
|---|---|
| Monday | 22°C |
| Tuesday | 24°C |
| Wednesday | 21°C |
| Thursday | 26°C |
| Friday | 25°C |
To draw a line graph, place the days along the horizontal axis and the temperature along the vertical axis. Plot a point for each reading, then join the points in day order.
The graph would rise from Monday to Tuesday, fall on Wednesday, rise to its highest point on Thursday, and fall slightly on Friday.
Now answer these questions:
- Which day was warmest? Thursday, at 26°C.
- Which day was coolest? Wednesday, at 21°C.
- How much did the temperature rise from Monday to Tuesday? (24 – 22 = 2)°C.
- How much did it fall from Thursday to Friday? (26 – 25 = 1)°C.
- What was the difference between the highest and lowest readings? (26 – 21 = 5)°C.
The line helps you see both the values and the direction of change.
3. Understanding Axes and Scales
Most standard graphs use two axes.
- The horizontal axis, often called the x-axis, runs from left to right.
- The vertical axis, often called the y-axis, runs from bottom to top.
The labels tell you what each axis represents. The scale tells you how to read the values.
Suppose a graph shows the height of a plant over several weeks. The horizontal axis might show the weeks, while the vertical axis shows the height in centimeters.
Always check the units. A height measured in centimeters is different from one measured in meters, even if the numbers look similar.
4. Finding Patterns and Changes
Graphs can help you spot patterns that may be difficult to notice in a table.
A line that rises shows an increase in the recorded value. A line that falls shows a decrease. A flat section means the value stayed the same between the readings.
For example, a plant’s height might be recorded as follows:
| Week | Plant height |
|---|---|
| 1 | 4 cm |
| 2 | 6 cm |
| 3 | 8 cm |
| 4 | 10 cm |
The plant grows by 2 cm each week. The pattern is regular, and the line graph would rise at a steady rate.
But real data does not always follow a neat pattern. The plant might grow quickly one week and slowly the next. A graph helps you describe what actually happened rather than assuming that every change is the same.
5. Comparing Data and Finding Differences
Graphs can help you compare groups and calculate differences.
Imagine two teams record how many points they score in four games.
| Game | Team Blue | Team Green |
|---|---|---|
| 1 | 12 | 10 |
| 2 | 15 | 14 |
| 3 | 11 | 16 |
| 4 | 18 | 17 |
You could display these results using a grouped bar graph, with two bars for each game.
Questions to explore:
- Which team scored more points in Game 2?
- Which team had the higher score in Game 3?
- What was Team Blue’s total score?
- What was Team Green’s total score?
- In which game was the difference between the scores greatest?
Answers
- Team Blue scored more in Game 2: 15 compared with 14.
- Team Green scored more in Game 3: 16 compared with 11.
- Team Blue’s total: (12 + 15 + 11 + 18 = 56).
- Team Green’s total: (10 + 14 + 16 + 17 = 57).
- Game 3 had the greatest difference: (16 – 11 = 5) points.
A graph helps you compare the results, but calculations can help you explain exactly how large the differences are.
6. Can a Graph Be Misleading?
Graphs are powerful, but you need to read them carefully. A graph can give the wrong impression if it uses an unclear scale or leaves out important information.
Look out for these common problems:
A scale that does not start at zero. This can make small differences between bars look much larger than they really are. Sometimes a shortened scale is useful, but it should be clearly shown and explained.
Missing labels. Without a title, units or axis labels, you might not know what the numbers represent.
Unequal bar widths. Bar graphs should use bars of equal width and consistent spacing. Otherwise, the display can make some groups look more important than others.
Missing information. A graph showing only part of a set of results may leave out details needed to understand the full picture.
A confusing scale. If the scale counts in fives, a bar reaching six intervals represents 30, not 6.
When you read a graph, ask yourself: What is being measured? What do the numbers mean? Is the scale clear? Does the graph show enough information for me to reach a sensible conclusion?
7. Choosing the Right Graph
Different graphs are useful for different jobs.
| Graph type | Best used for |
|---|---|
| Picture graph (pictograph) | Showing small amounts of data with pictures or symbols |
| Bar graph | Comparing separate groups or categories |
| Line graph | Showing how values change over time |
| Table | Organizing exact values so they are easy to find |
You do not always need a complicated graph. Choose the simplest display that communicates your information clearly.
⭐⭐⭐ Champions Activity: Investigate the Data
A cyclist records the distance travelled during five training sessions.
| Session | Distance |
|---|---|
| 1 | 3 km |
| 2 | 5 km |
| 3 | 4 km |
| 4 | 7 km |
| 5 | 6 km |
Answer the questions:
- Which session had the greatest distance?
- Between which two sessions did the distance increase the most?
- Between which two sessions did the distance decrease?
- What was the total distance travelled?
- What was the difference between the longest and shortest distances?
- Which type of graph would be useful for showing how the distance changed across the sessions? Explain why.
Check your answers
- Session 4, with 7 km.
- From Session 3 to Session 4, the distance increased by (7 – 4 = 3) km.
- The distance decreased from Session 2 to Session 3 and from Session 4 to Session 5.
- (3 + 5 + 4 + 7 + 6 = 25) km.
- (7 – 3 = 4) km.
- A line graph is a good choice because the sessions are in order and the graph shows how the distance changed from one session to the next.
⭐⭐⭐ Extra Challenge: Be a Data Detective
Two graphs show the number of books read by two groups of children. One graph starts its vertical scale at zero, while the other begins at 8.
The bars look very different, even though the actual numbers are close together.
Your task: Explain why the second graph might make the difference look bigger than it really is. Then suggest what you should check before deciding which graph gives the fairest impression.
Think it through: A scale that begins at 8 leaves out the lower part of the number range. This can make small differences between values appear much larger visually. Check the scale, labels and full data before drawing a conclusion.
Graphs: Quick Reference Guide
| Key word | What it means |
|---|---|
| Graph | A visual way to display information |
| Data | Information that has been collected |
| Pictograph | A graph that uses pictures or symbols |
| Bar graph | A graph that uses bars to compare groups |
| Line graph | A graph that uses plotted points, usually joined by lines |
| Tally chart | A way to record counts using tally marks |
| Frequency | How many times something occurs |
| Key | An explanation of what each picture or symbol represents |
| Scale | The number intervals used to read a graph |
| Axis | A reference line on a graph |
| Trend | The general direction in which values change |
Top Tips for Graph Success
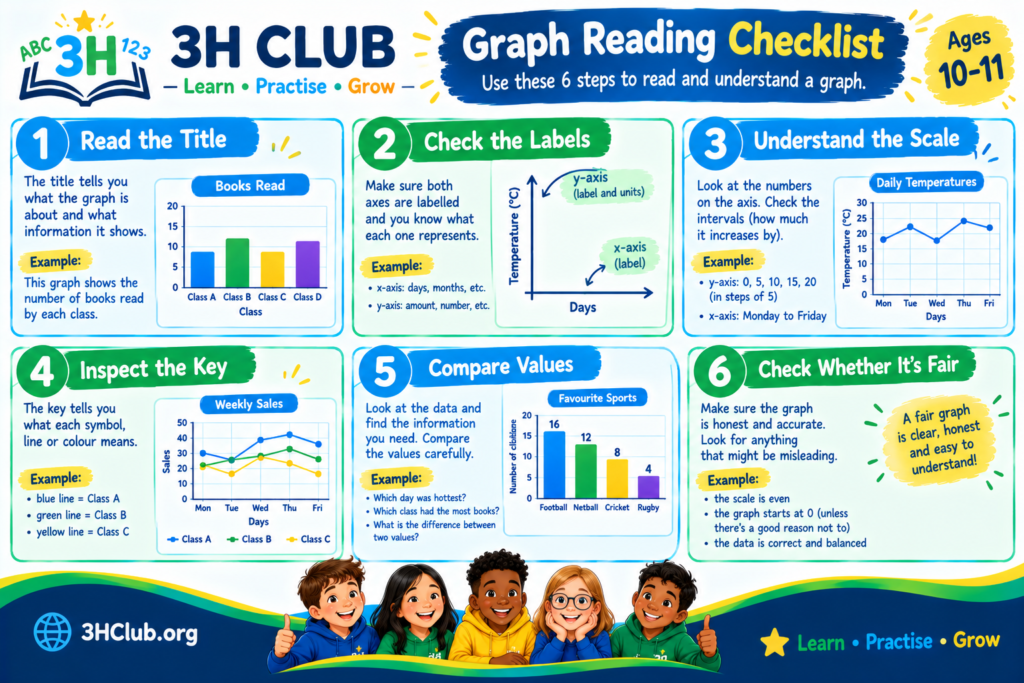
- Read the title first so you know what the graph is about.
- Check the labels, units and scale before reading values.
- Look carefully at what each picture or symbol represents.
- Use the graph to compare values, then calculate differences when needed.
- When creating a graph, use a suitable scale and label everything clearly.
- Choose a graph type that suits your data.
- Do not guess. Use the values and scale to support your answer.
- Check whether the graph gives a fair and complete picture of the information.
Frequently Asked Questions About Graphs
What is a graph in maths?
A graph is a visual way of showing information. It can use pictures, bars or lines to help you compare values, spot patterns and answer questions.
What is the difference between a bar graph and a line graph?
A bar graph is generally used to compare separate groups, such as favorite fruits or sports. A line graph is often used to show how a value changes over time, such as temperature during a week.
What is a pictograph?
A pictograph is a graph that uses pictures or symbols to represent data. Its key explains how much each picture stands for.
Why do graphs need titles and labels?
Titles and labels explain what the graph shows and what the numbers mean. Without them, it can be difficult to understand the information correctly.
What does a scale mean on a graph?
A scale shows the number intervals used to read values. It might count in ones, twos, fives, tens or another suitable step.
How do I make a graph?
First, collect your data and organise it in a table. Choose a suitable graph type, add a title and labels, select a clear scale, and draw the bars or plot the points accurately. Check your work before finishing.
Why are graphs useful in everyday life?
Graphs help people understand information quickly. They are used to show weather changes, sports scores, survey results, scientific measurements, business figures and much more.
Keep Learning with 3HClub!
Great work! You have explored picture graphs, bar graphs, scales, tally charts and line graphs. You have also practiced comparing data, spotting patterns and checking whether a graph tells a fair story.
The next time you see a chart in a book, newspaper or on a screen, take a closer look. What information does it show? What can you learn from it? What questions can you answer?
Keep asking questions, keep practicing and keep growing your maths skills with 3HClub!
Learn • Practice • Grow