Turn Math Into Picture Stories!
What Are Graphs? 📊
Have you ever tried to remember a long list of numbers? It can be super tricky!
Imagine asking 30 friends to name their favorite fruit: 🍎 apples, 🍌 bananas, or 🍇 grapes. Writing down 30 names on a sheet of paper looks messy. But what if you could turn that list into a colorful picture story?
That is exactly what a graph does! A graph takes information (which mathematicians call data) and turns it into a visual map that is super easy to read and understand.
🔍 1. Meet the Graph Squad!
Different kinds of information need different kinds of graphs. Let’s meet the most common ones you’ll use in school!
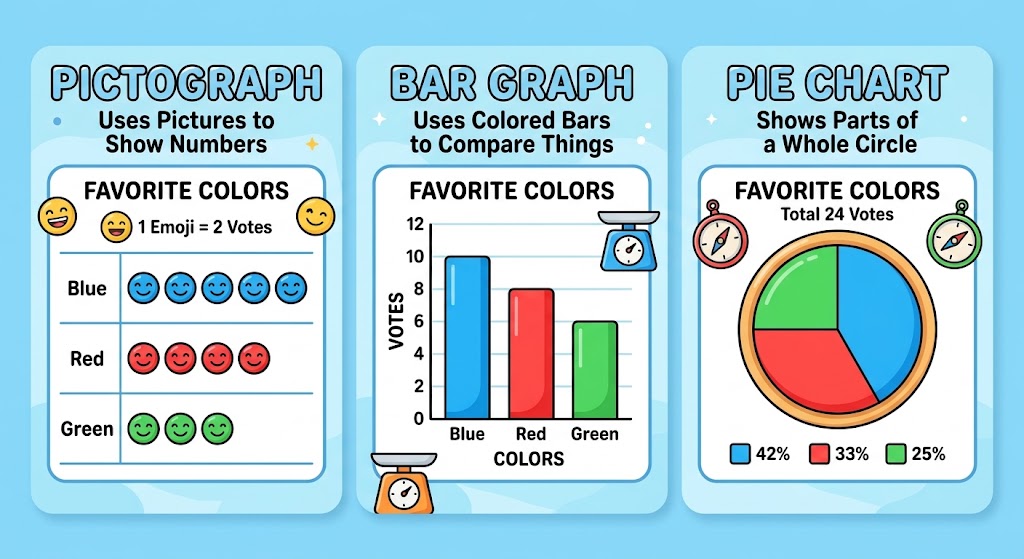
🎨 A. Pictographs (Best for Ages 6–8)
-
What it is: A graph that uses small pictures or icons to show numbers.
-
How it works: If 4 kids like apples, you draw 4 pictures of apples 🍎🍎🍎🍎!
-
Secret Detective Tip: Always check the Key! Sometimes 1 picture equals 2 or 5 items instead of just 1.
📊 B. Bar Graphs (Best for Ages 8–11)
-
What it is: A graph that uses colorful bars or columns to compare items.
-
How it works: Each item gets its own bar. The taller or longer the bar, the bigger the number!
-
How to read it:
-
Look at the bottom line (X-axis) to see the items.
-
Look at the side line (Y-axis) to see how high the number goes.
-
🥧 C. Pie Charts (Best for Ages 9–11)
-
What it is: A graph shaped like a giant pizza or pie!
-
How it works: The whole circle represents everything ($100\%$).
-
How to read it: Each category gets a slice. The bigger the slice, the more popular that choice is!
⚖️ 2. The 4 Essential Parts of Every Graph

Every great graph has 4 special parts that give you clues to solve the picture puzzle:
-
🏷️ Title: Tells you what story the graph is telling (e.g., “Our Favorite Playground Games”).
-
➡️ X-Axis (Horizontal Line): The line along the bottom that names the categories.
-
⬆️ Y-Axis (Vertical Line): The line going up the side with numbers.
-
🔑 Key / Legend: Explains what the colors or picture symbols mean.
💡 3. How to Read a Graph in 3 Easy Steps
Follow this quick detective checklist whenever you meet a new graph:
🚀 4. Try It Yourself! (Graph Detective Quiz)

Let’s test your detective skills! Imagine your class surveyed everyone’s favorite pet:
-
🐶 Dogs: 10 votes
-
🐱 Cats: 6 votes
-
🐹 Hamsters: 3 votes
Quiz Questions:
-
If you made a Bar Graph, which animal would have the tallest bar?
-
How many more kids voted for Dogs than Cats? ($10 – 6 = \text{?}$)
-
Which graph would be easiest to use if you drew small pictures of animal paws? (Pictograph or Pie Chart?)
(Answers: 1. Dogs, 2. 4 more kids, 3. Pictograph)